Creating State Diagrams with Umbrello 5
Table of Contents
- Introduction to State Diagrams
- Getting Started
- Creating Initial State
- Adding States
- Adding Activities to States
- Creating Transitions
- Naming Transitions
- Finalizing the Diagram
- Saving and Exporting
1. Introduction to State Diagrams
State diagrams in UML model the behavior of a system by showing the different states an object can have and how those states change in response to events. They are particularly useful for:
- Modeling lifecycle of objects
- Describing event-driven systems
- Representing user interface flows
- Modeling real-time and reactive systems
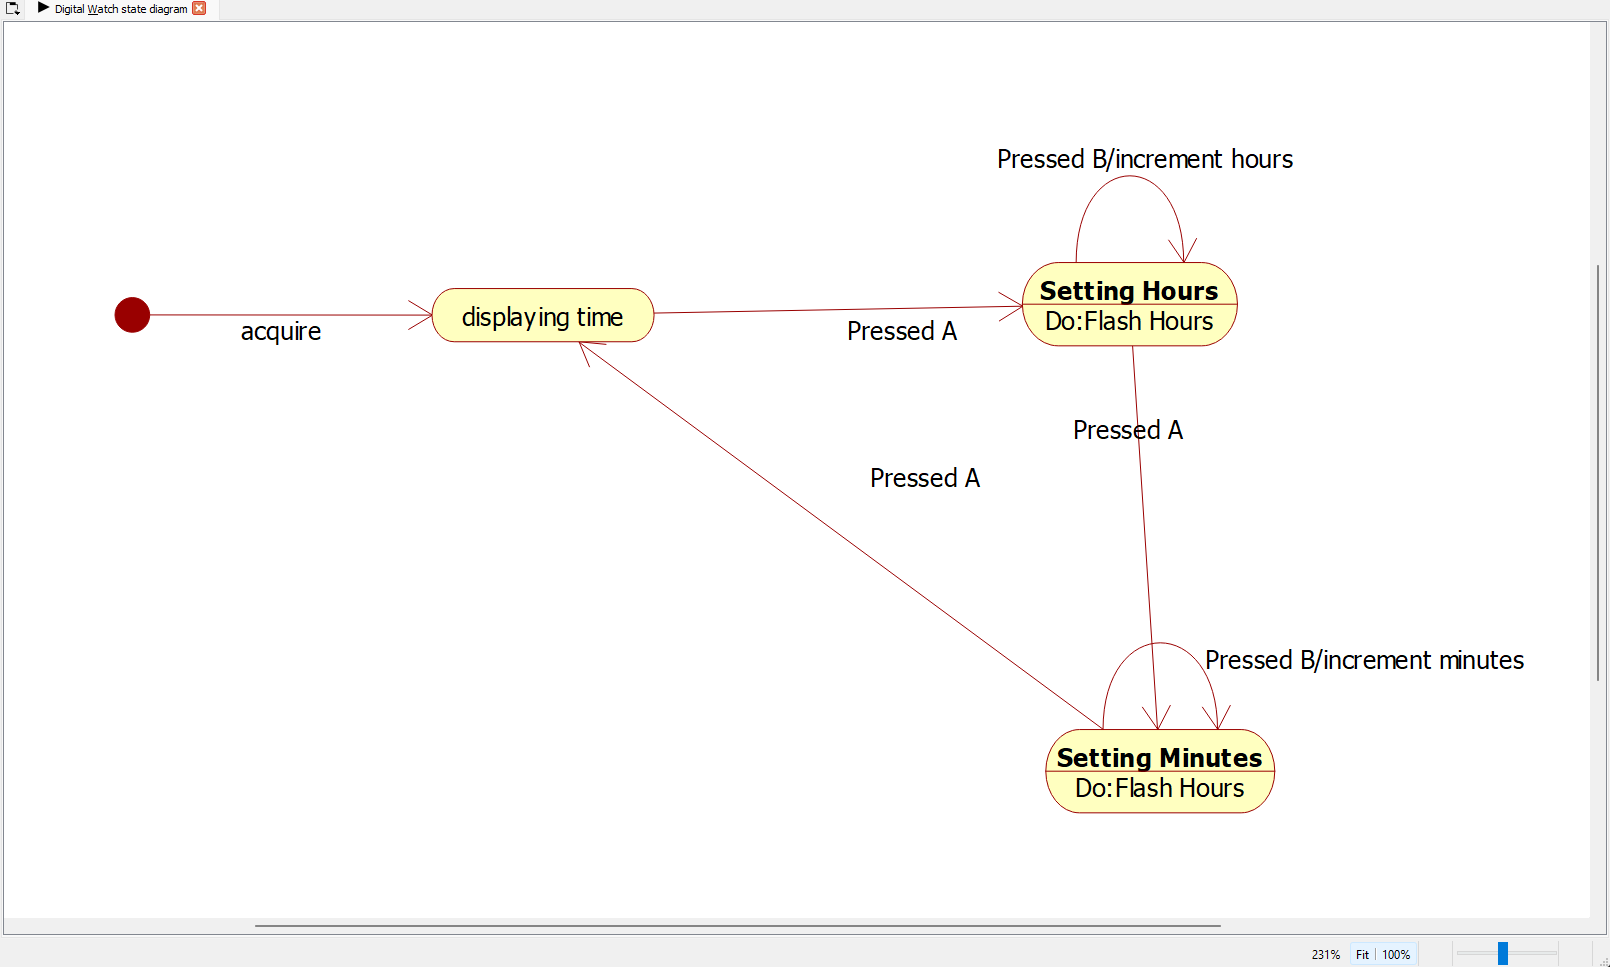
In our tutorial, we'll create a state diagram for a simple digital watch with two buttons (A and B) that has different modes for displaying and setting time.
2. Getting Started
Creating a New State Diagram
-
Launch Umbrello 5
-
Go to Diagram → New → State Diagram
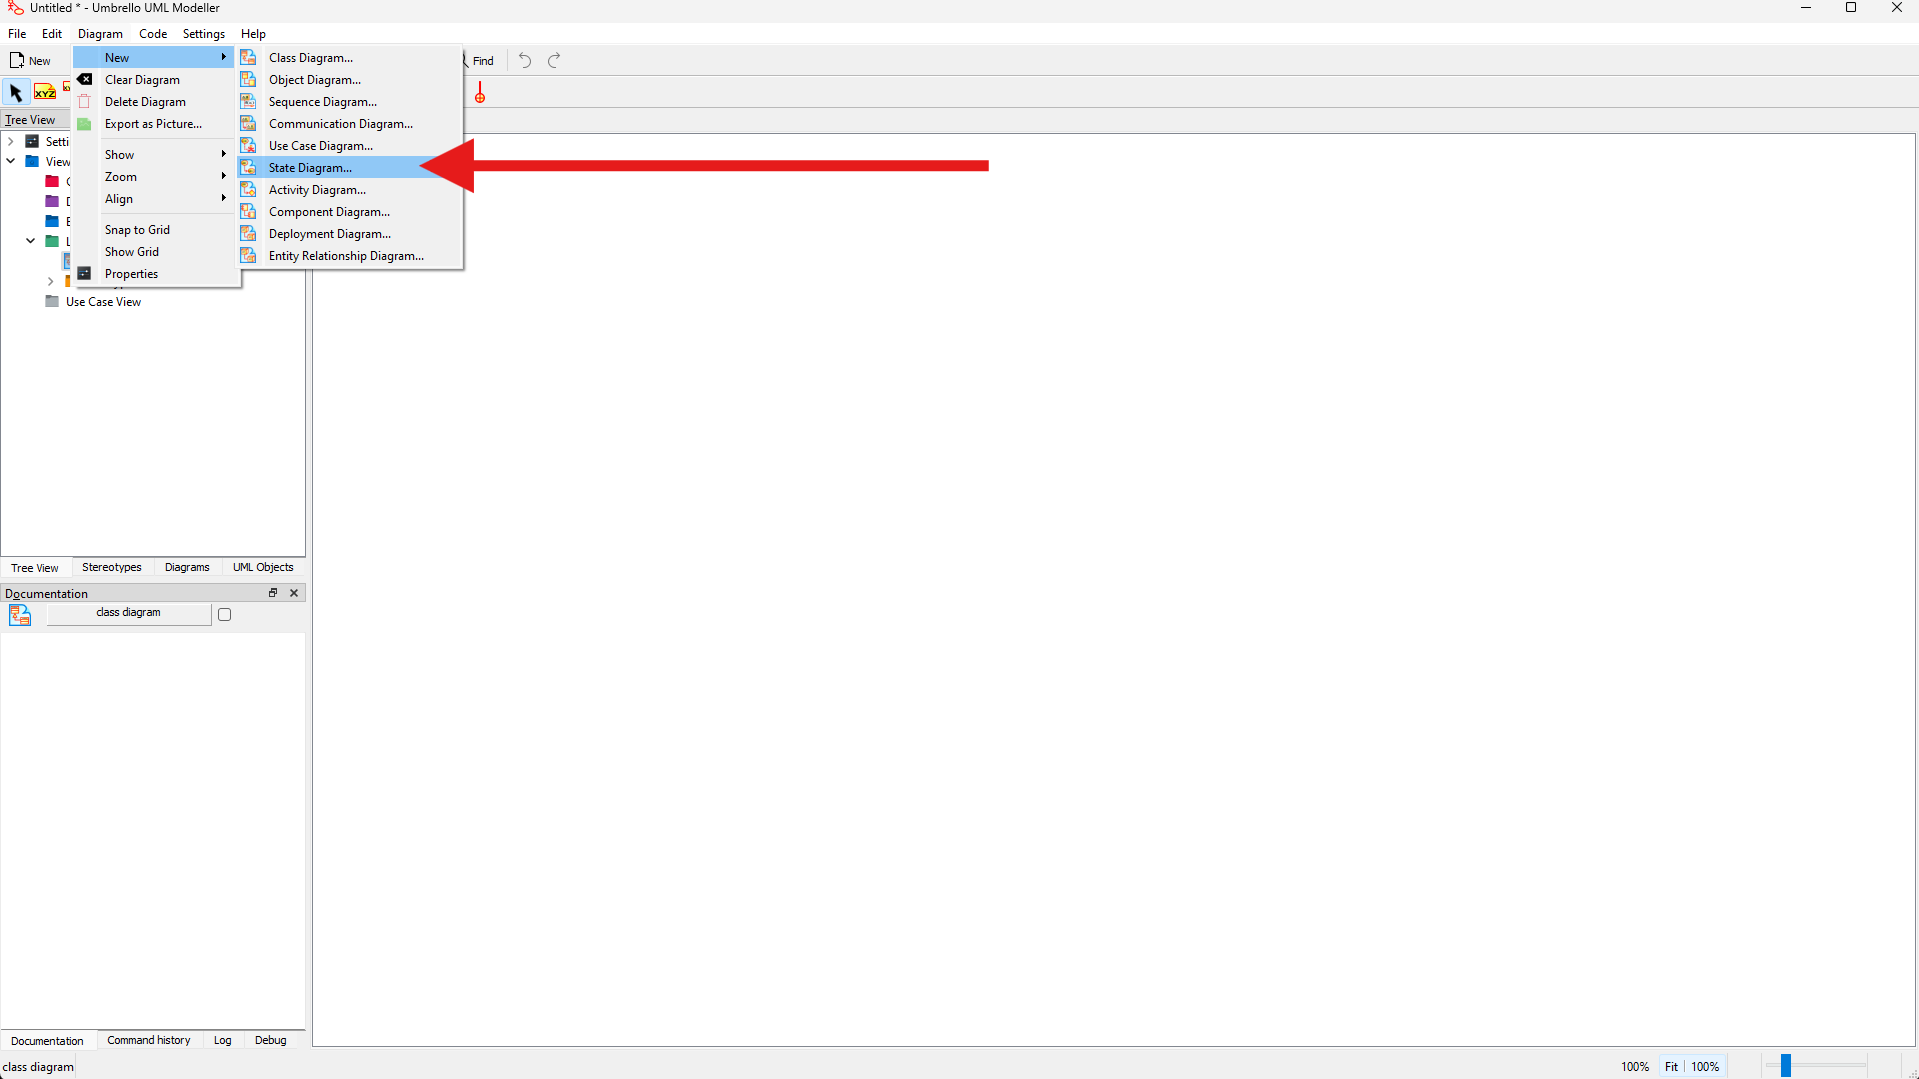 Creating a new state diagram
 -
Name your diagram (e.g., "Digital Watch state diagram")
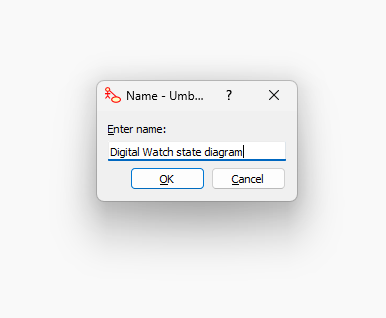 Naming the state diagram
3. Creating Initial State
Adding Initial State
- Right-click on the canvas and select New → Initial State
- Click on the diagram where you want to place the initial state
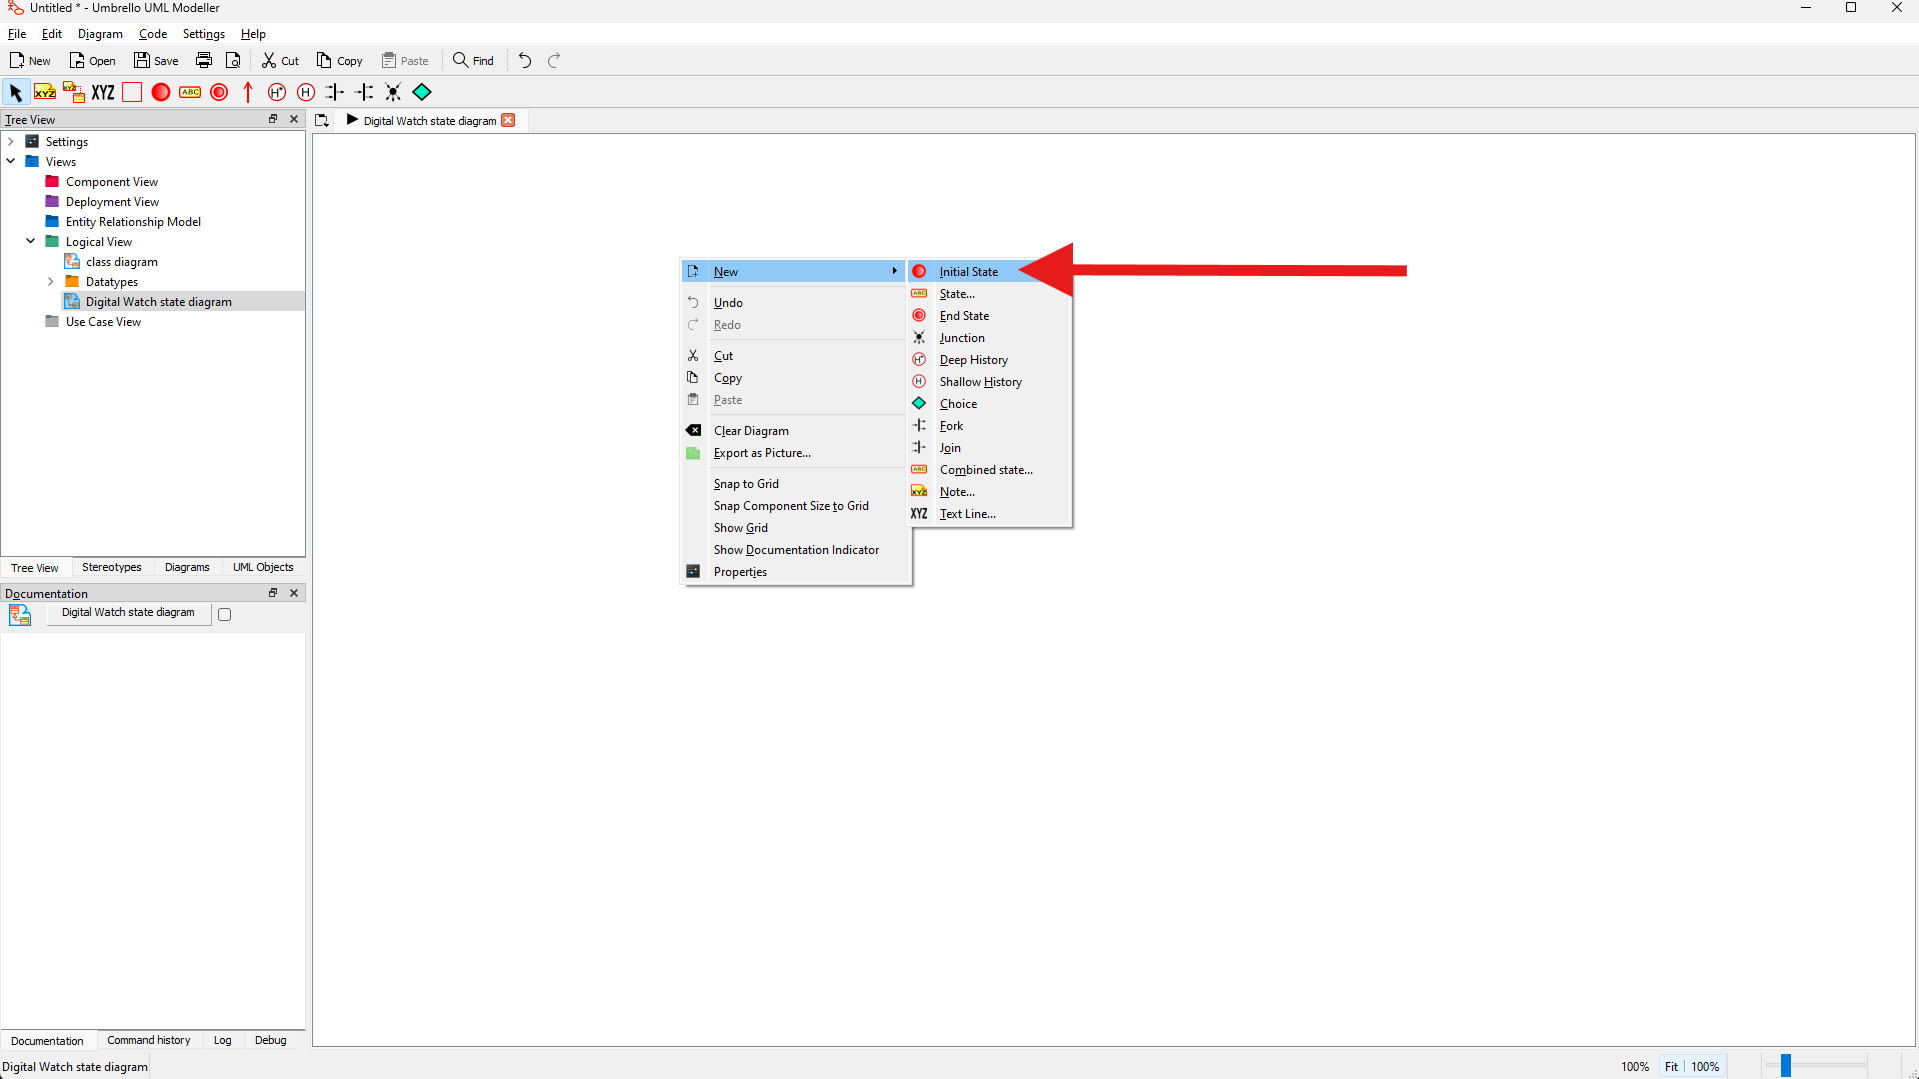 Adding an initial state to the diagram
4. Adding States
Creating the Display Time State
- Right-click on the initial state
- Select New → State
- Give it a name (e.g., "displaying time")
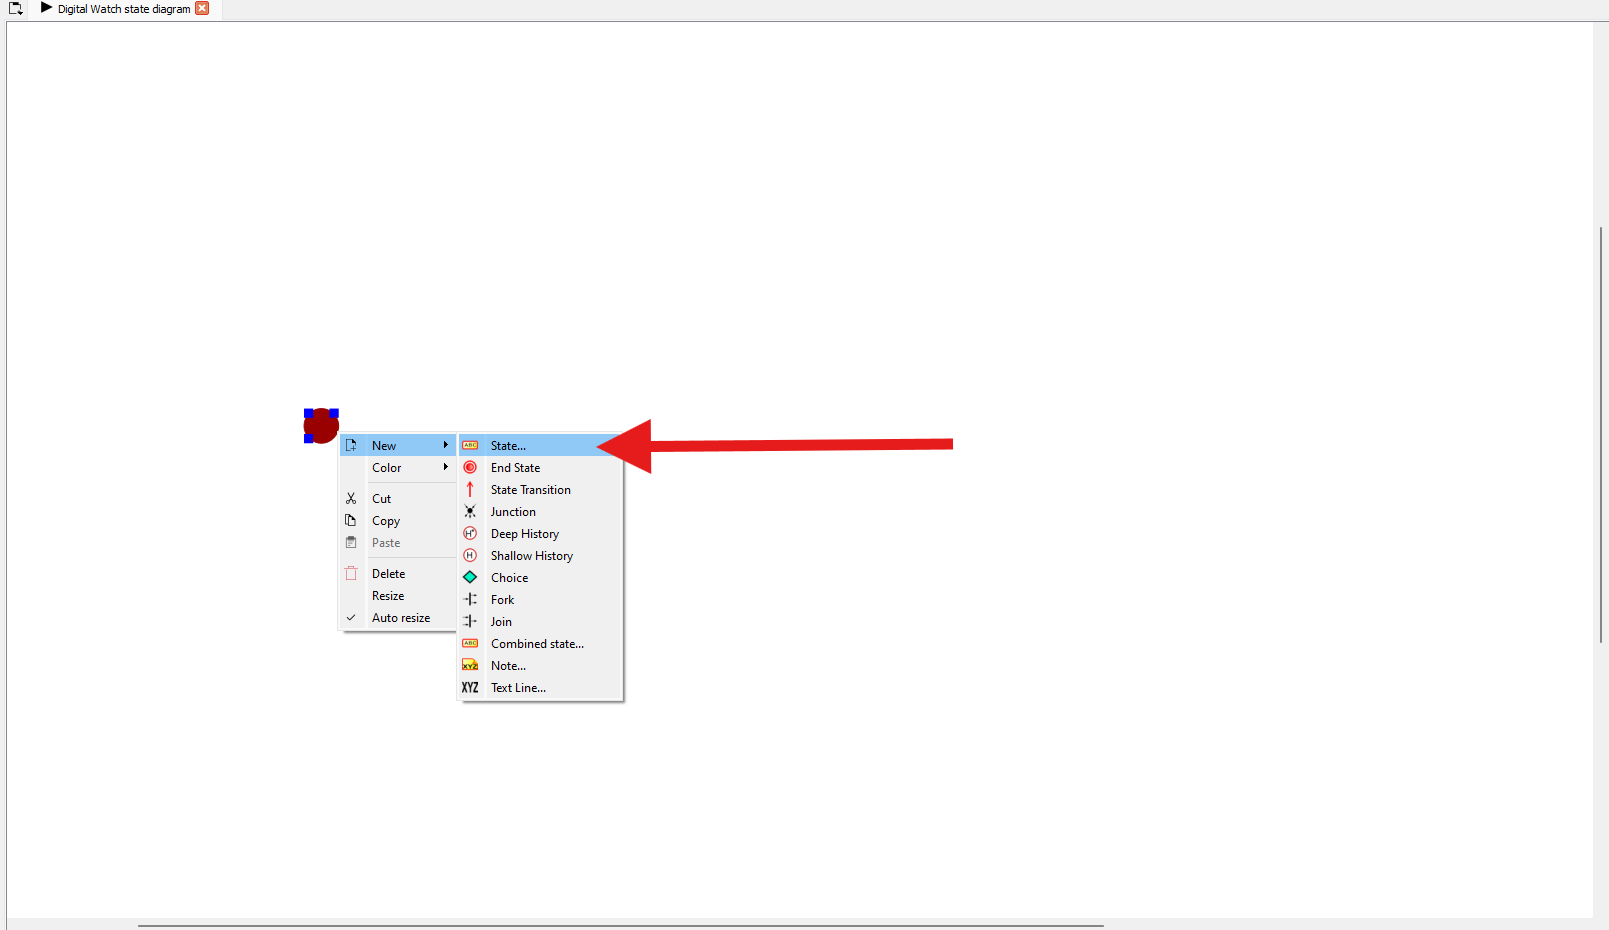 Adding the display time state
Creating Additional States
- Create additional states for the watch's different modes
- Right-click on the previously created state and select New → State
- Add states for "Setting Hours" and "Setting Minutes"
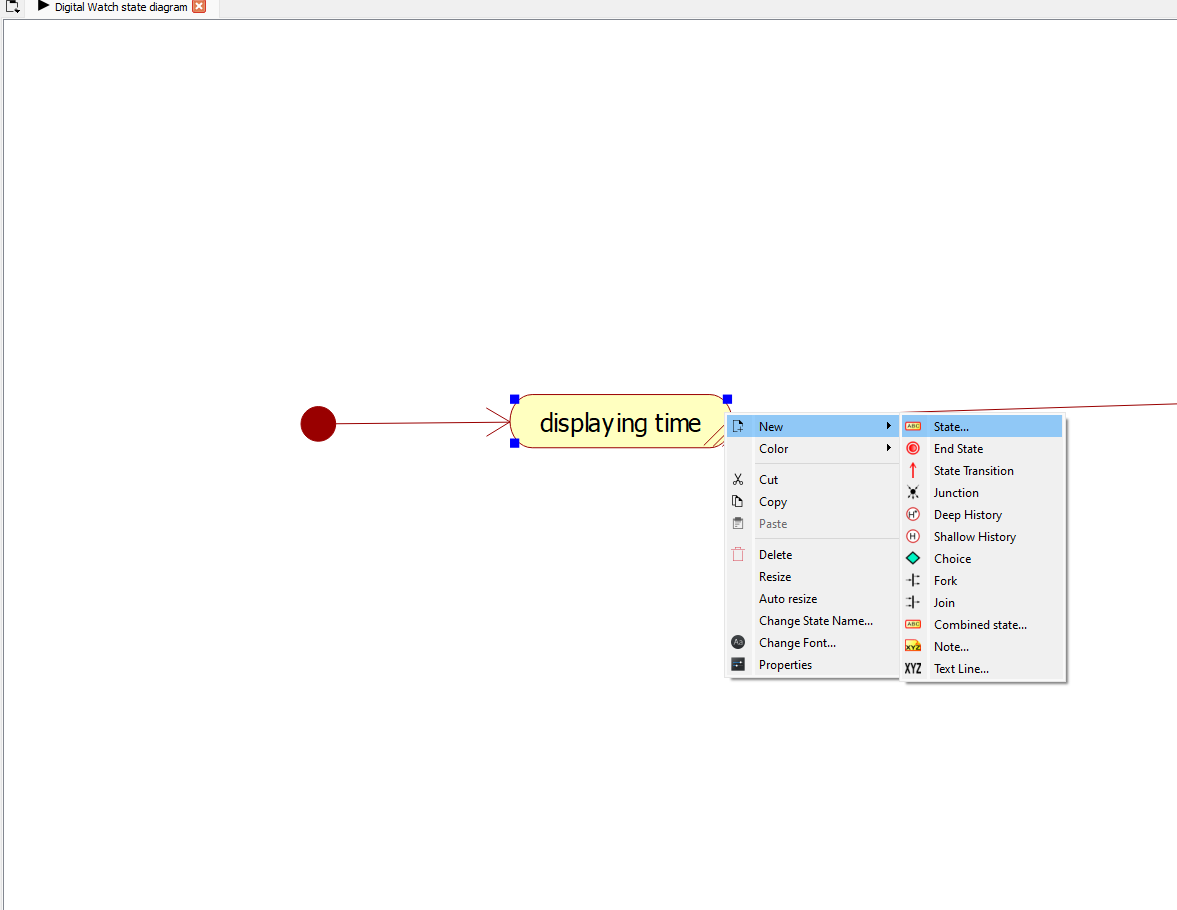 Adding additional states
5. Adding Activities to States
Adding Activities to States
- Right-click on a state and select Properties
- Go to the Activities tab
- Add activities like "Do:Flash Hours" for the setting hours state
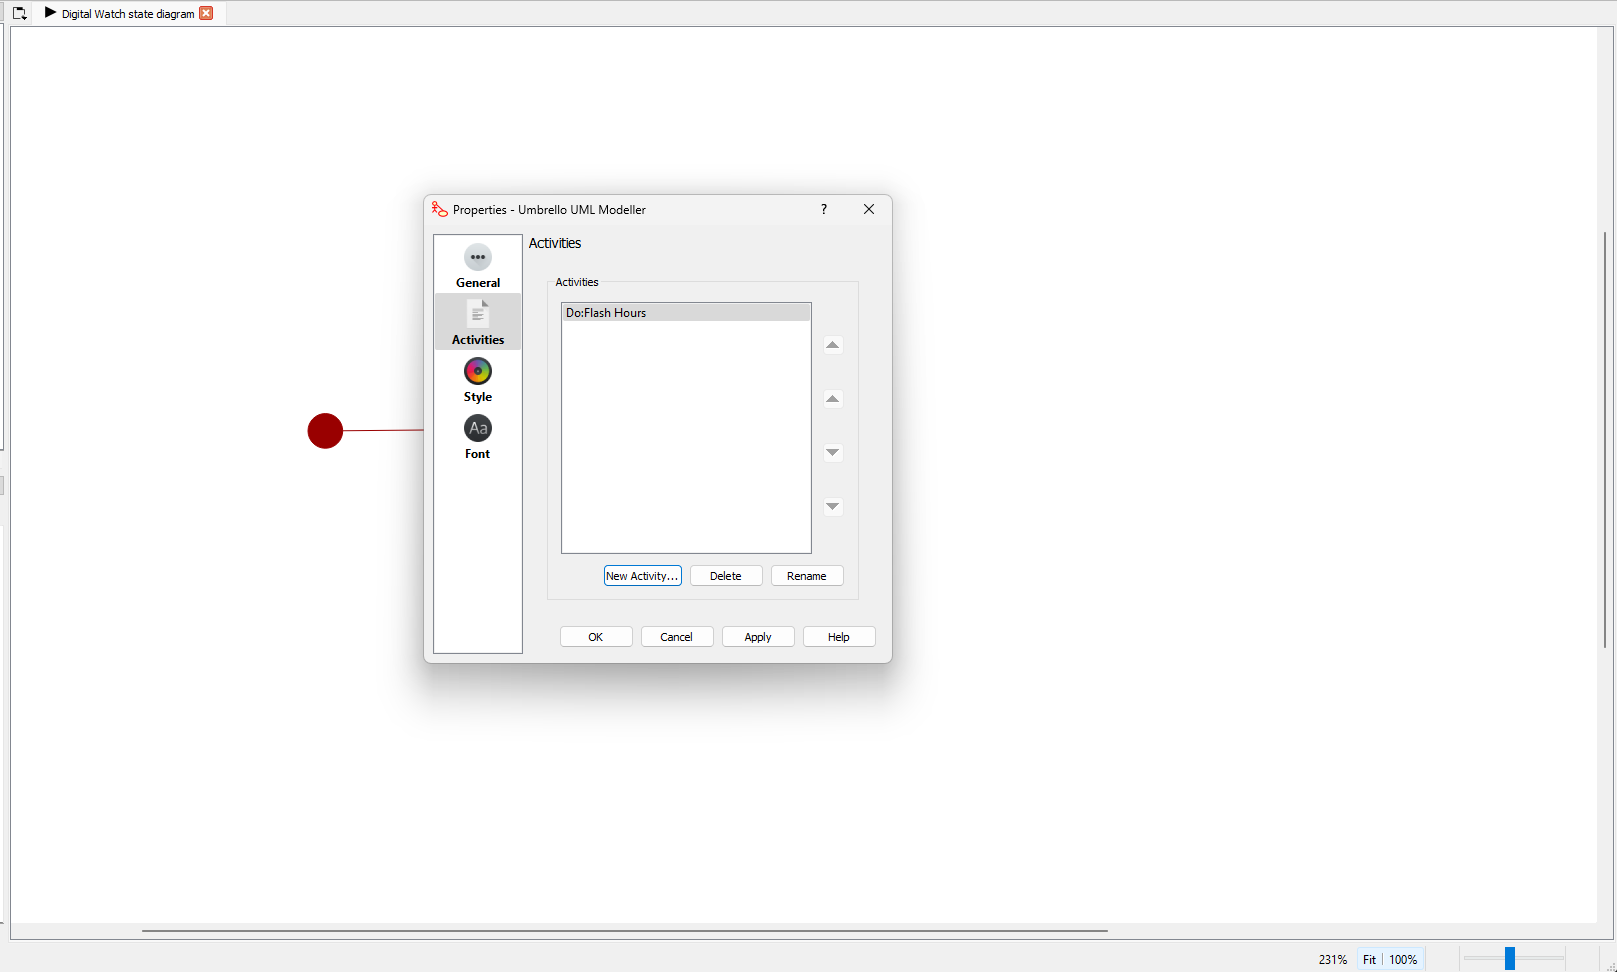 Adding activities to states
Creating Final State
- Right-click on the Setting Hours State and select New → New State
- Place it on your diagram to represent the termination point (if needed)
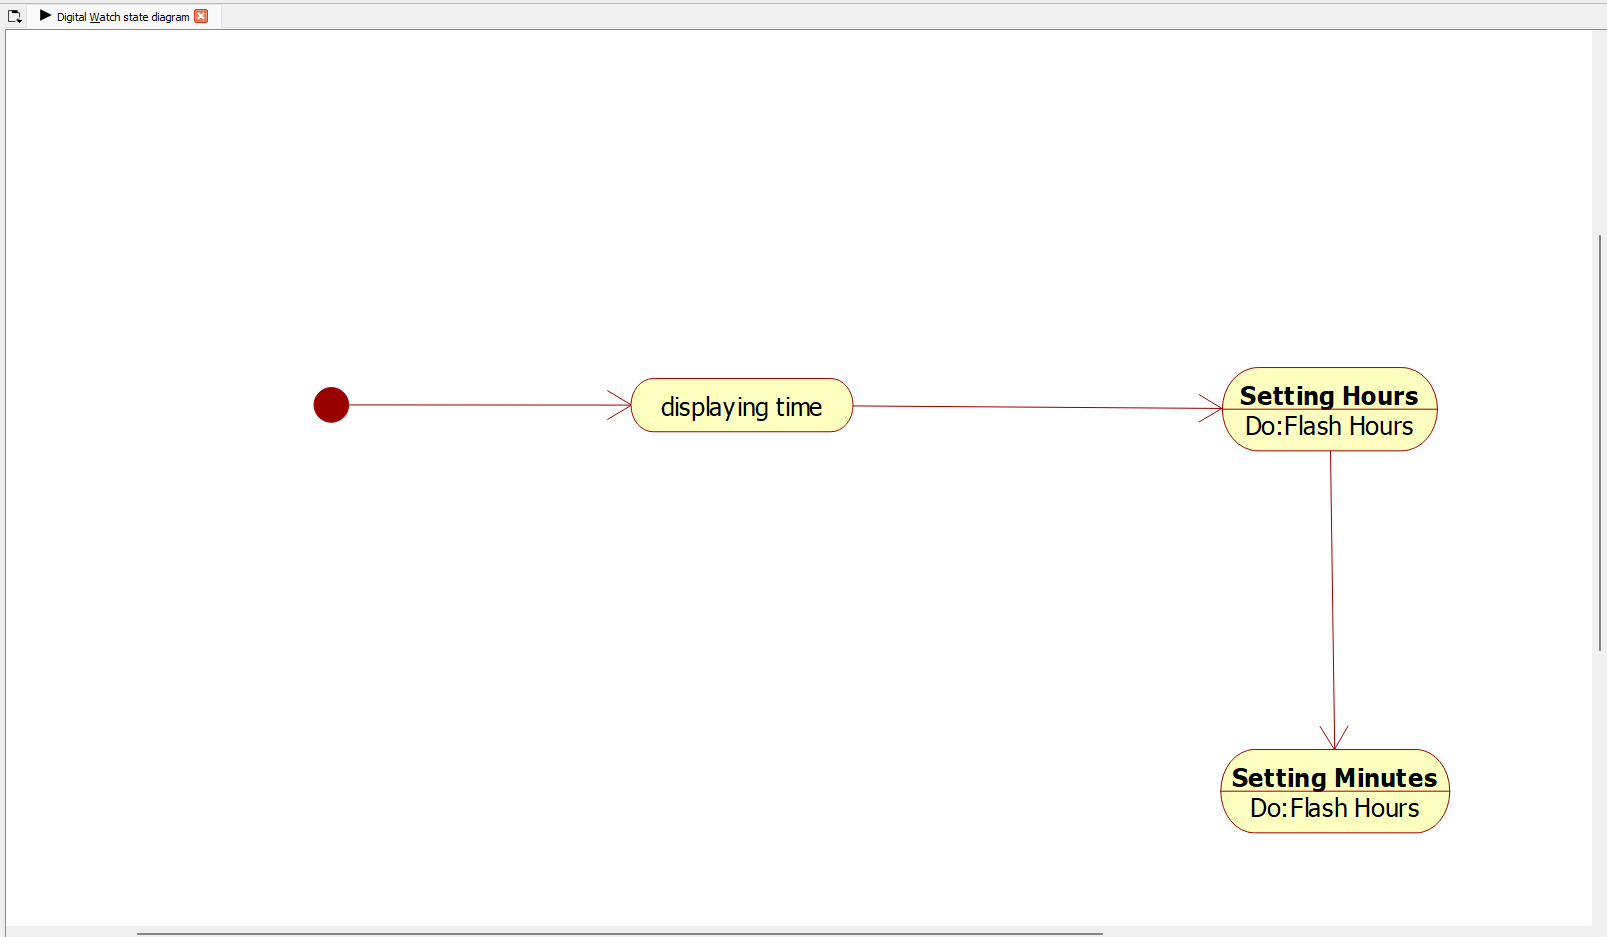 Adding a final state if needed
6. Creating Transitions
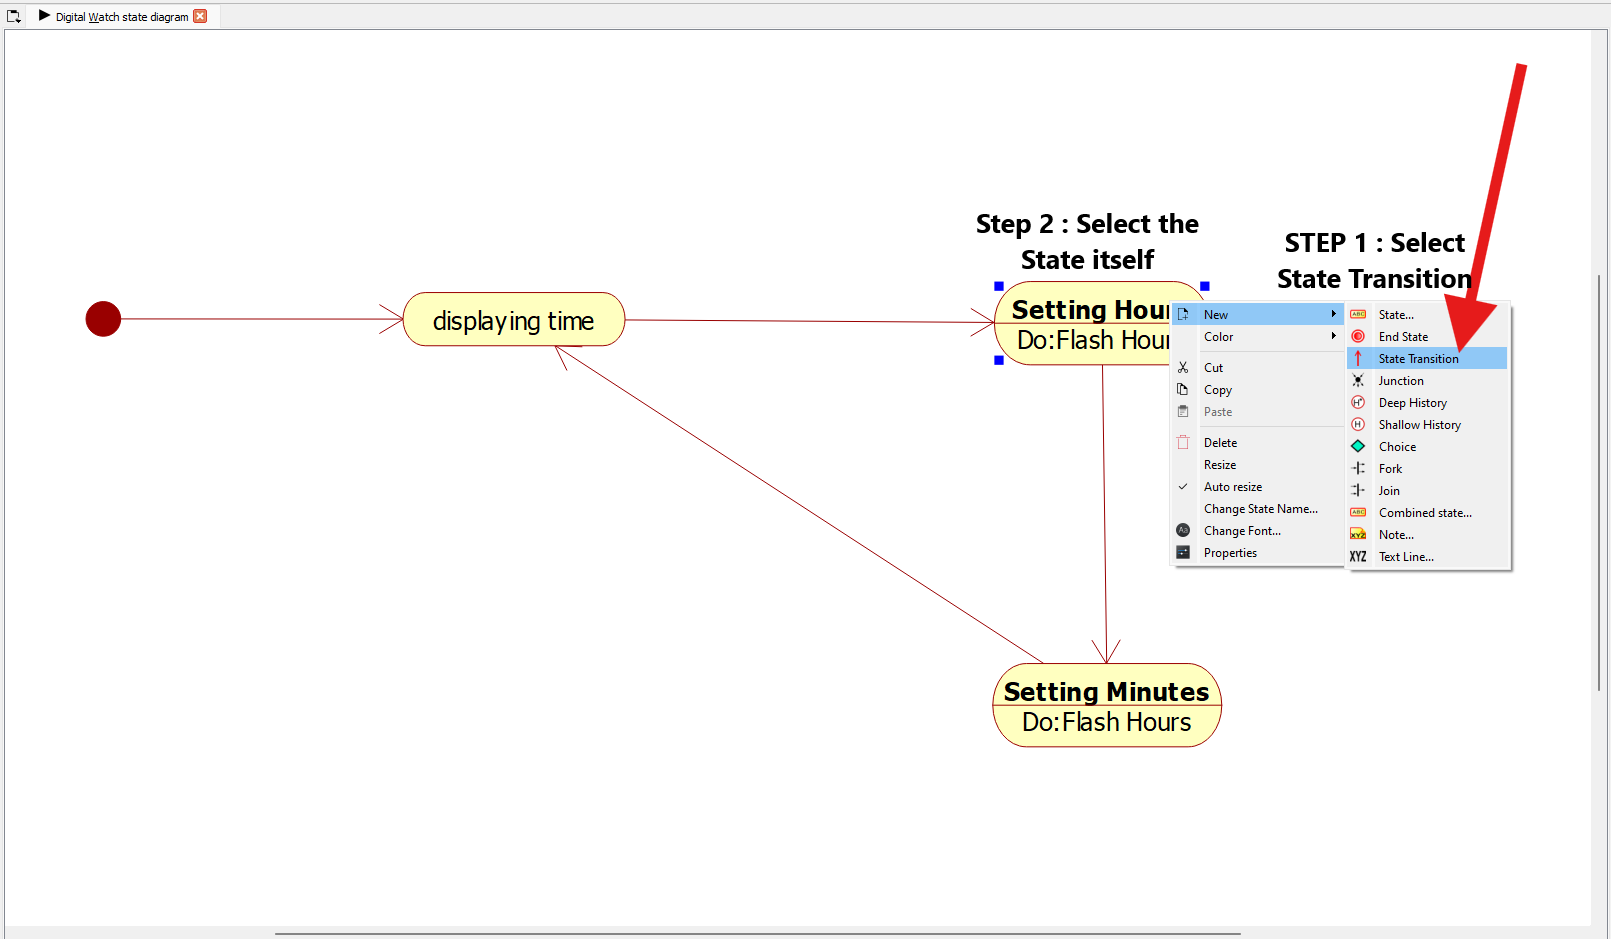
Adding Basic Transitions
- Right-click on the source state
- Select New → State Transition
- Click on the target state to create the transition
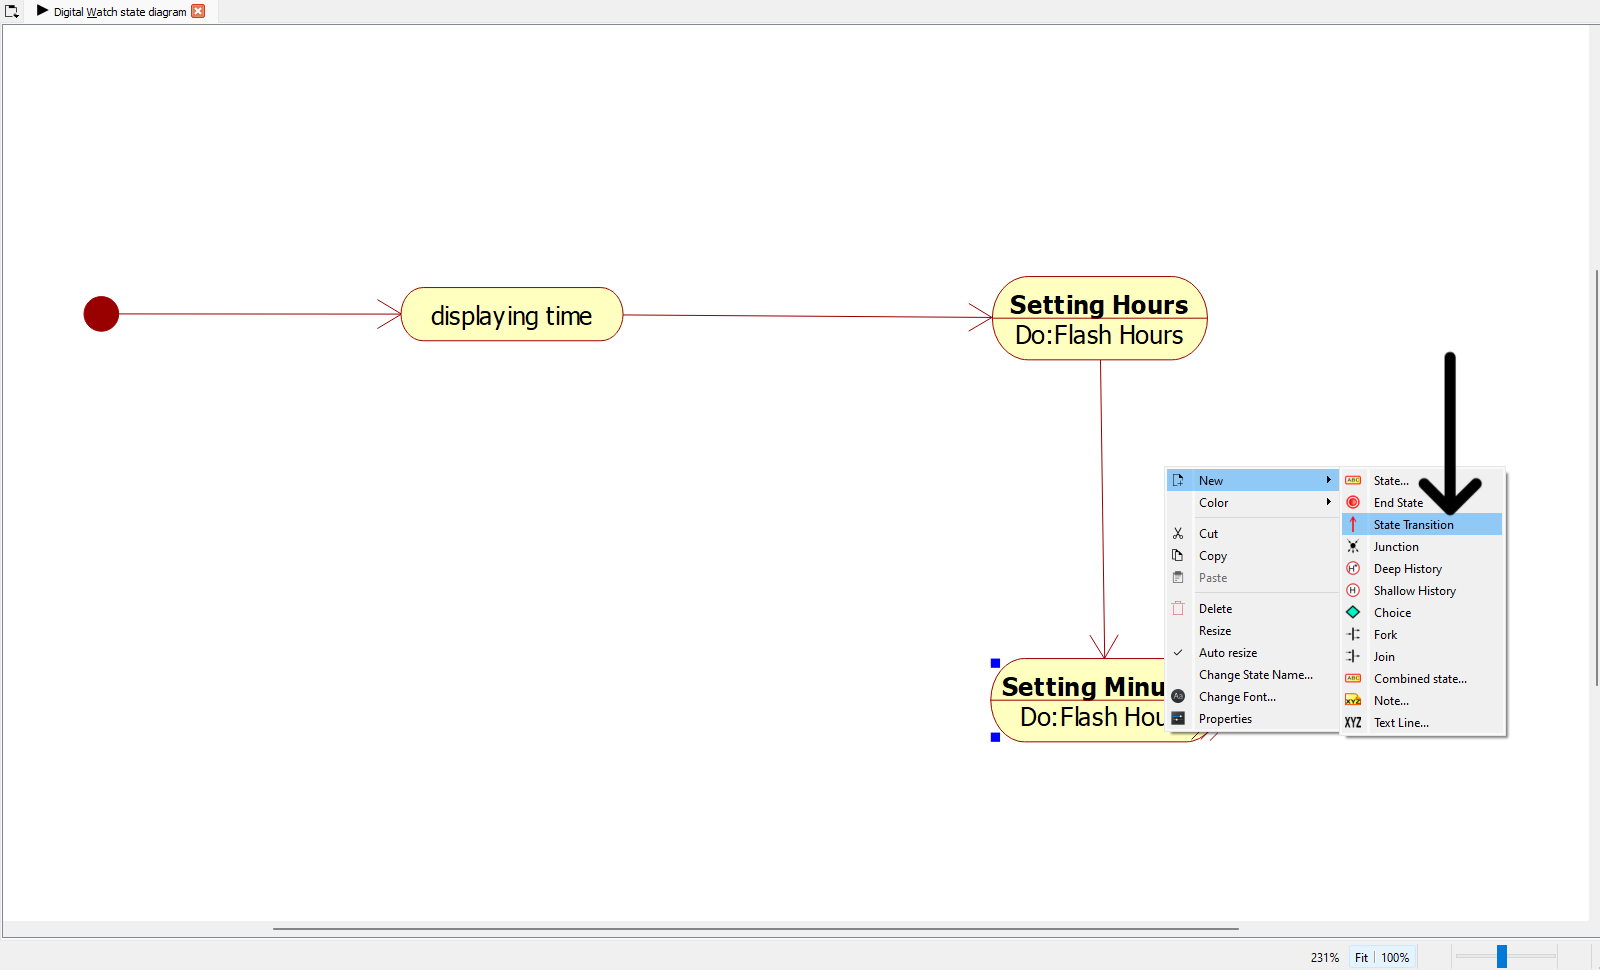 Creating transitions between states
Creating Self-Transitions
- Right-click on a state
- Select New → State Transition
- Click on the same state to create a self-transition
 Creating self-transitions
Adjusting Transition Routes
- Right-click on a transition line
- Select Layout → Spline to create curved transitions
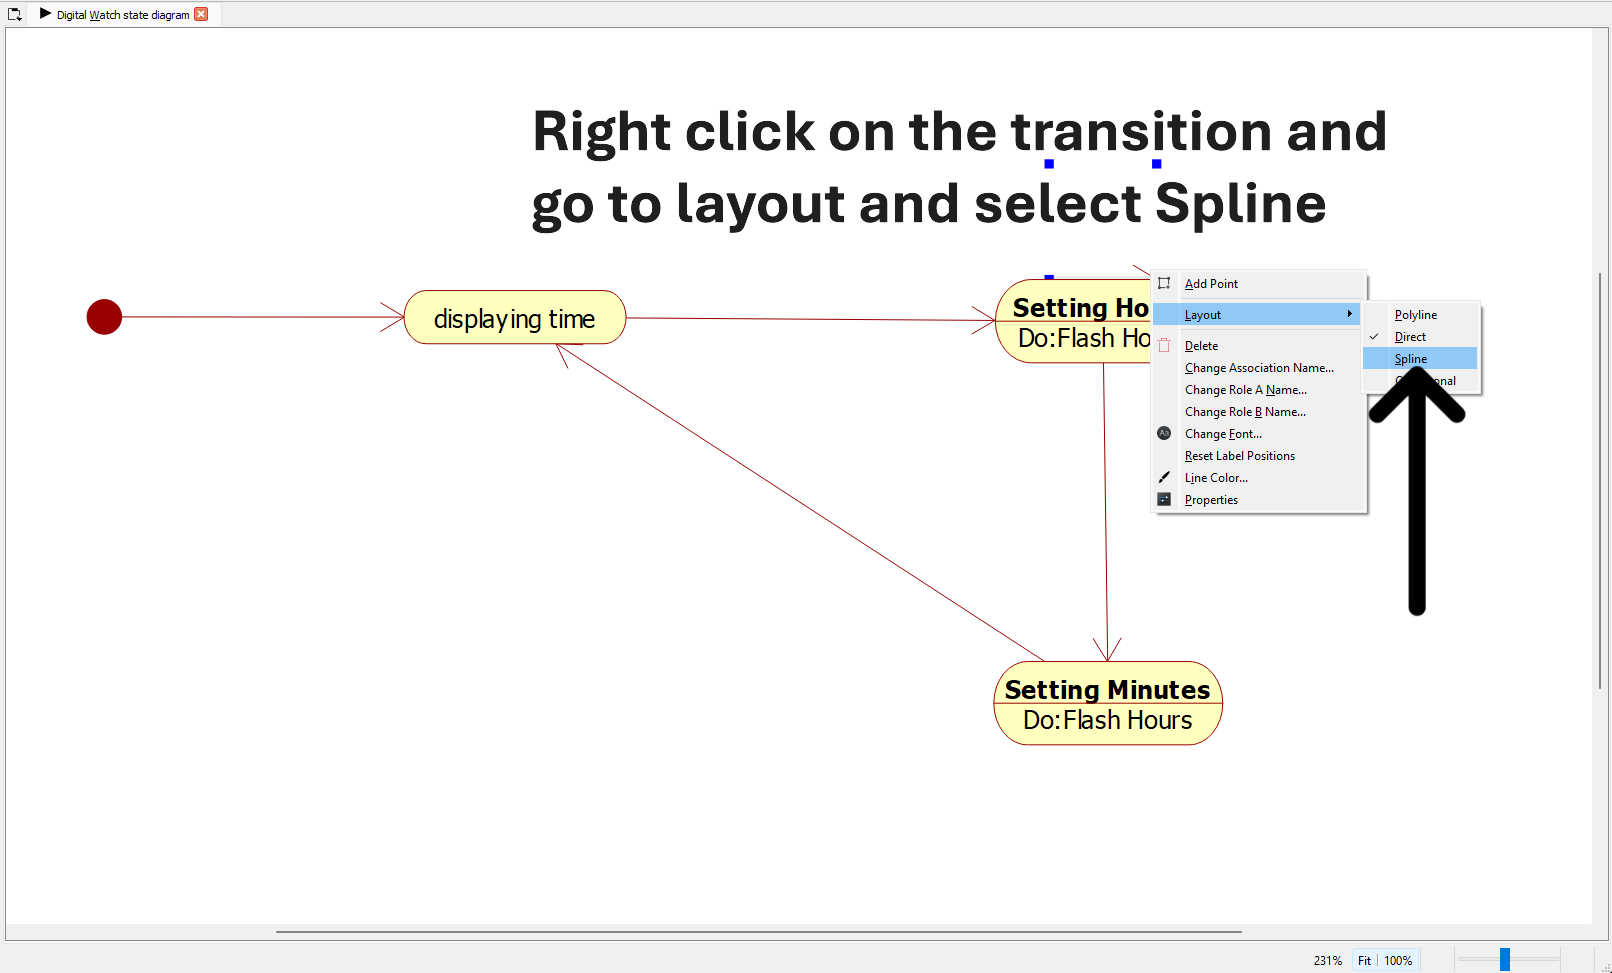 Adjusting transition appearance with spline layout
Positioning Transition Curve for Clarity
- Select the state and move it to improve Transition Curve
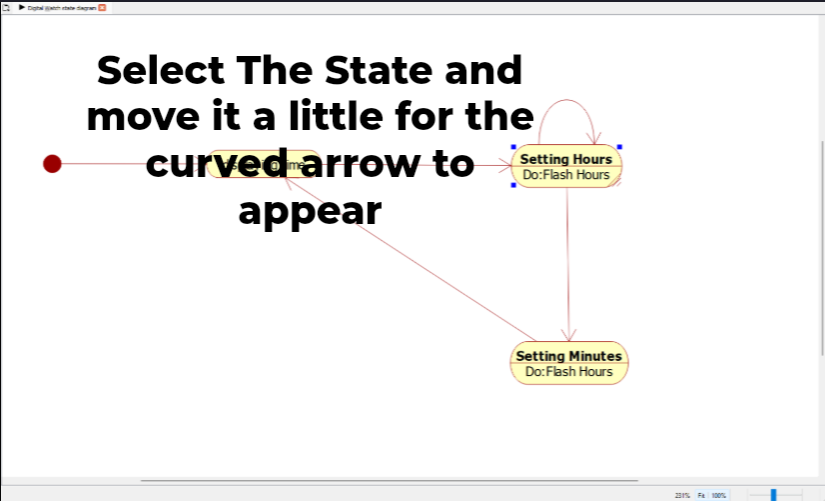 Positioning states for better layout
7. Naming Transitions
Opening Properties for Final Adjustments
- Right-click on elements to access their Properties
- Make final adjustments to name
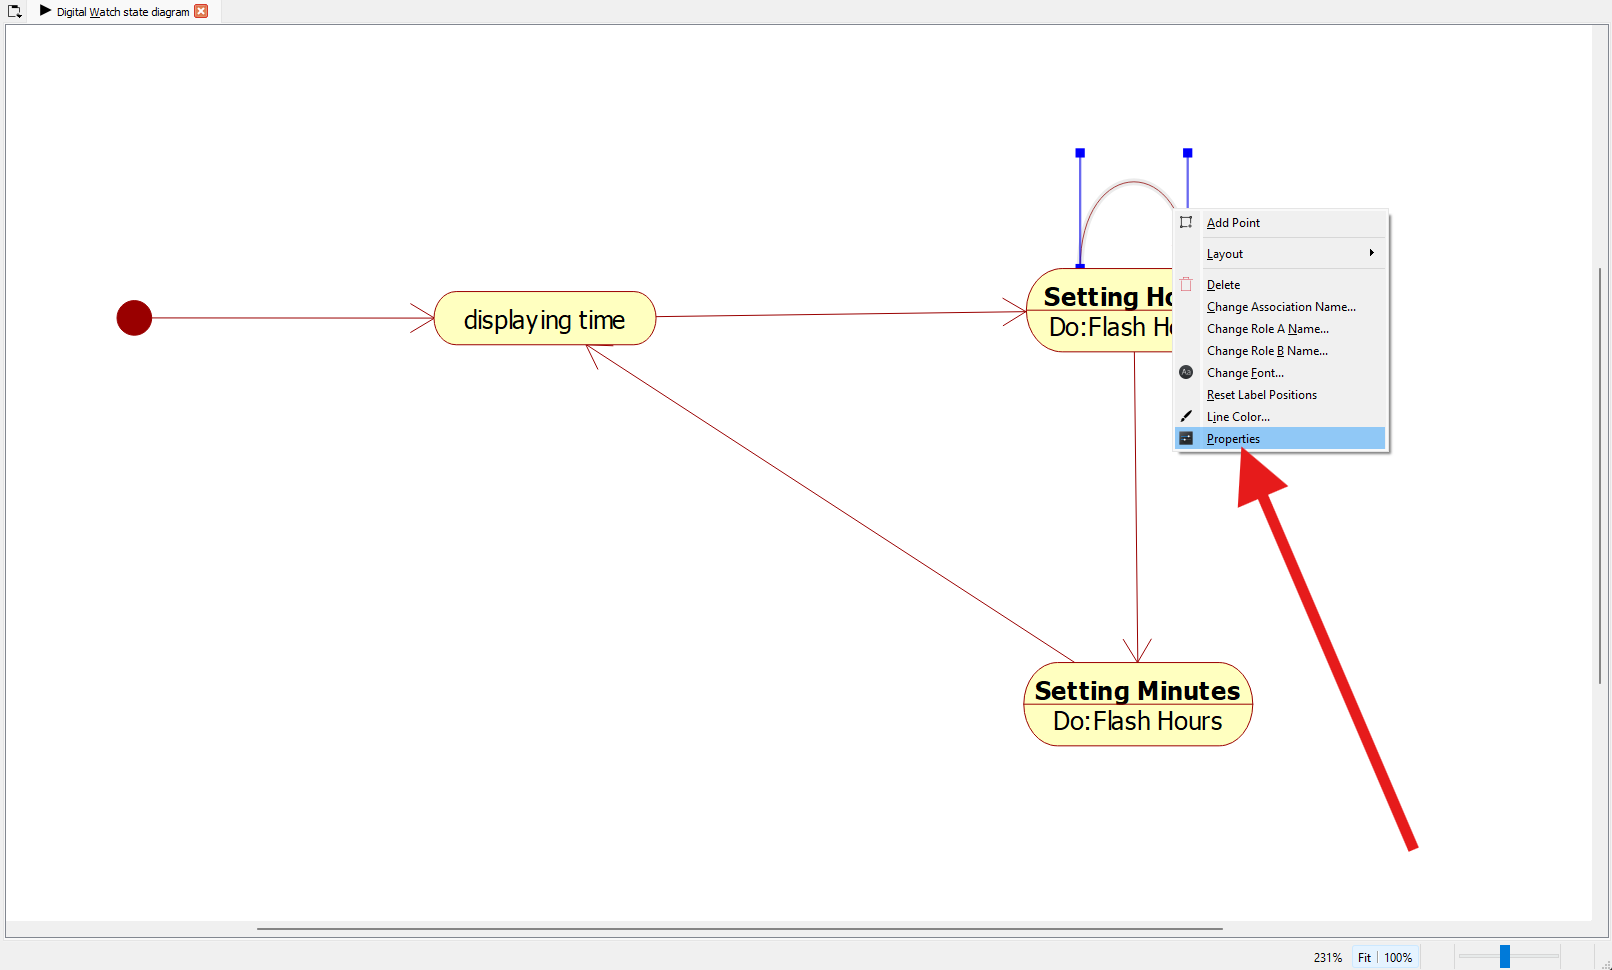 Making final adjustments through properties dialog
Setting Transition Triggers
-
Right-click on the transition line
-
Select Properties
-
In the General tab, set the name (e.g., "Pressed B/increment hours") to indicate what triggers the transition
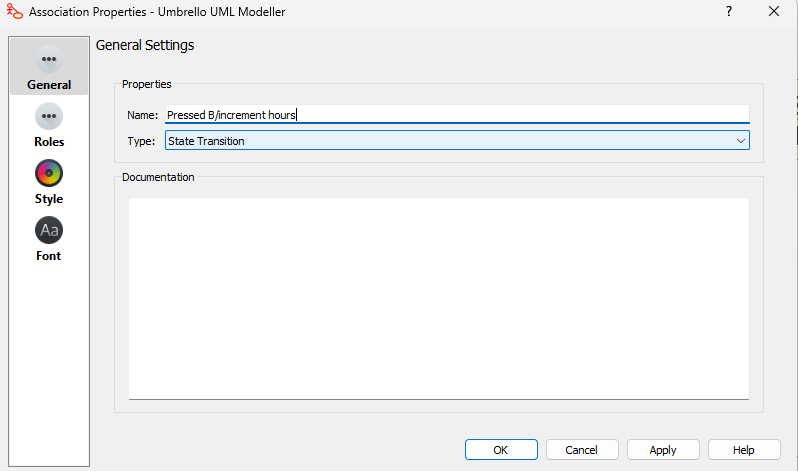 Naming transitions with their triggers
 -
Adjust position of transition names for better readability
 Fine-tuning transition label positions
8. Finalizing the Diagram
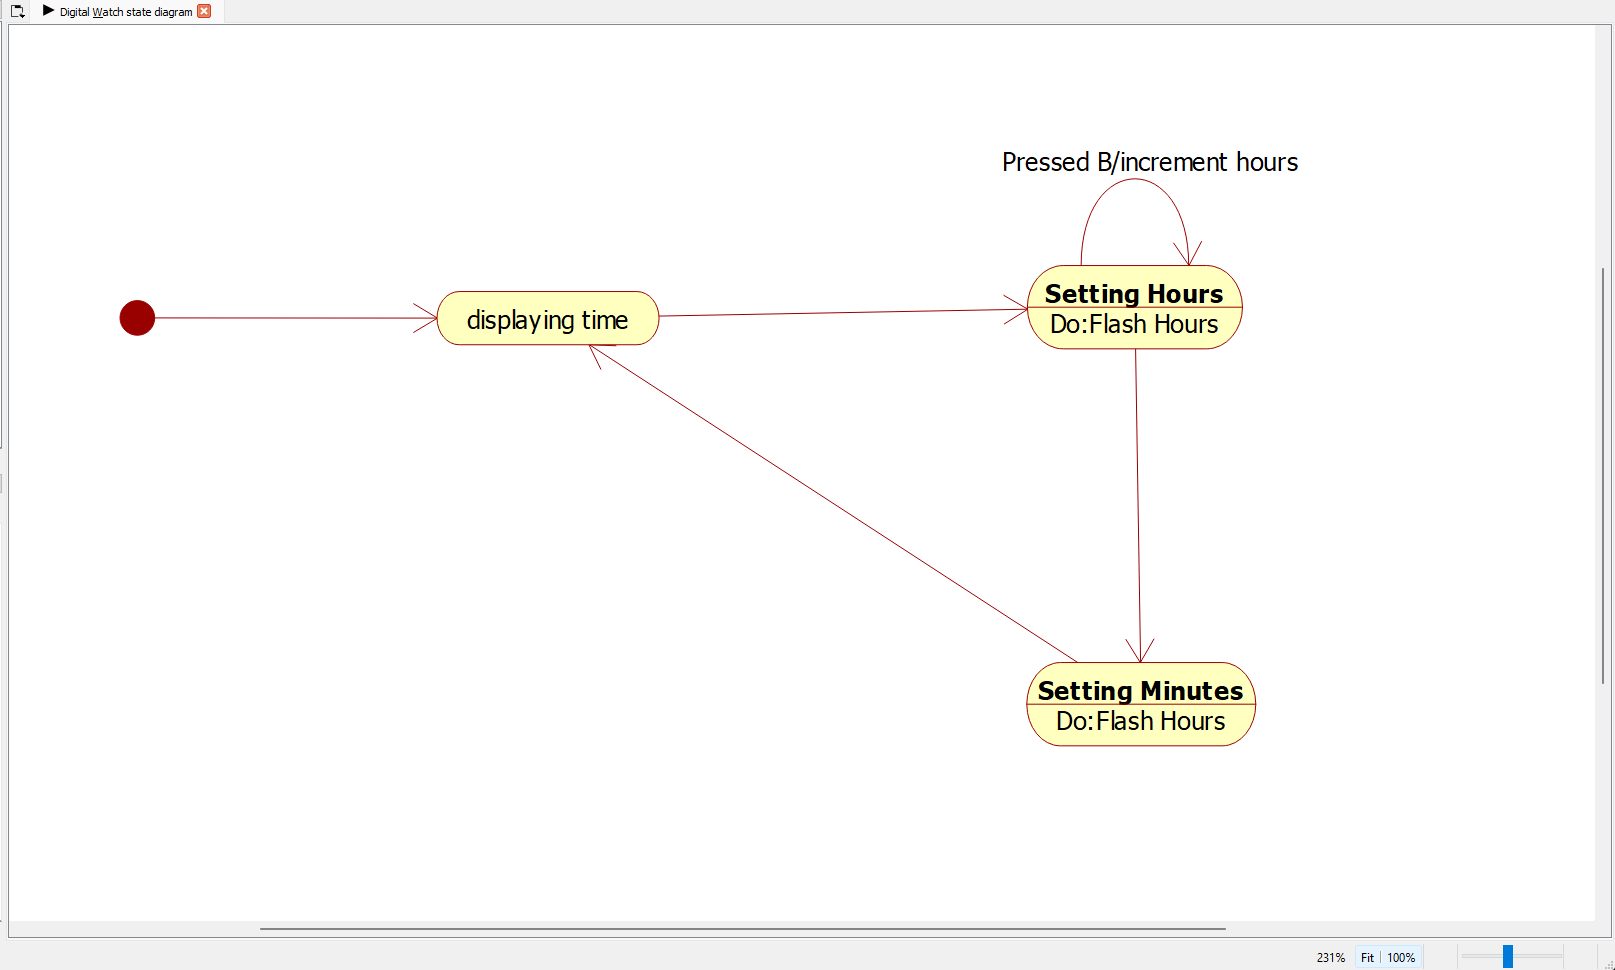
Complete the Digital Watch State Diagram
- Add remaining transitions between states
- Name all transitions according to their triggers (button presses)
- Add appropriate activities to each state
Completed digital watch state diagram
9. Saving and Exporting
Saving Your Work
- Go to File → Save As
- Choose a location and filename
- Select .xmi format
Printing or Exporting
- Go to File → Export as Picture
- Select desired format (PNG, SVG, etc.)
- Choose location and save
Keyboard Shortcuts
- Ctrl+S: Save
- Ctrl+Z: Undo
- Ctrl+Y: Redo
- Delete: Remove selected element
Remember that state diagrams should clearly show how an object moves from one state to another based on events. Use appropriate naming for states and transitions to make your diagram easy to understand.